
CalcGen AI
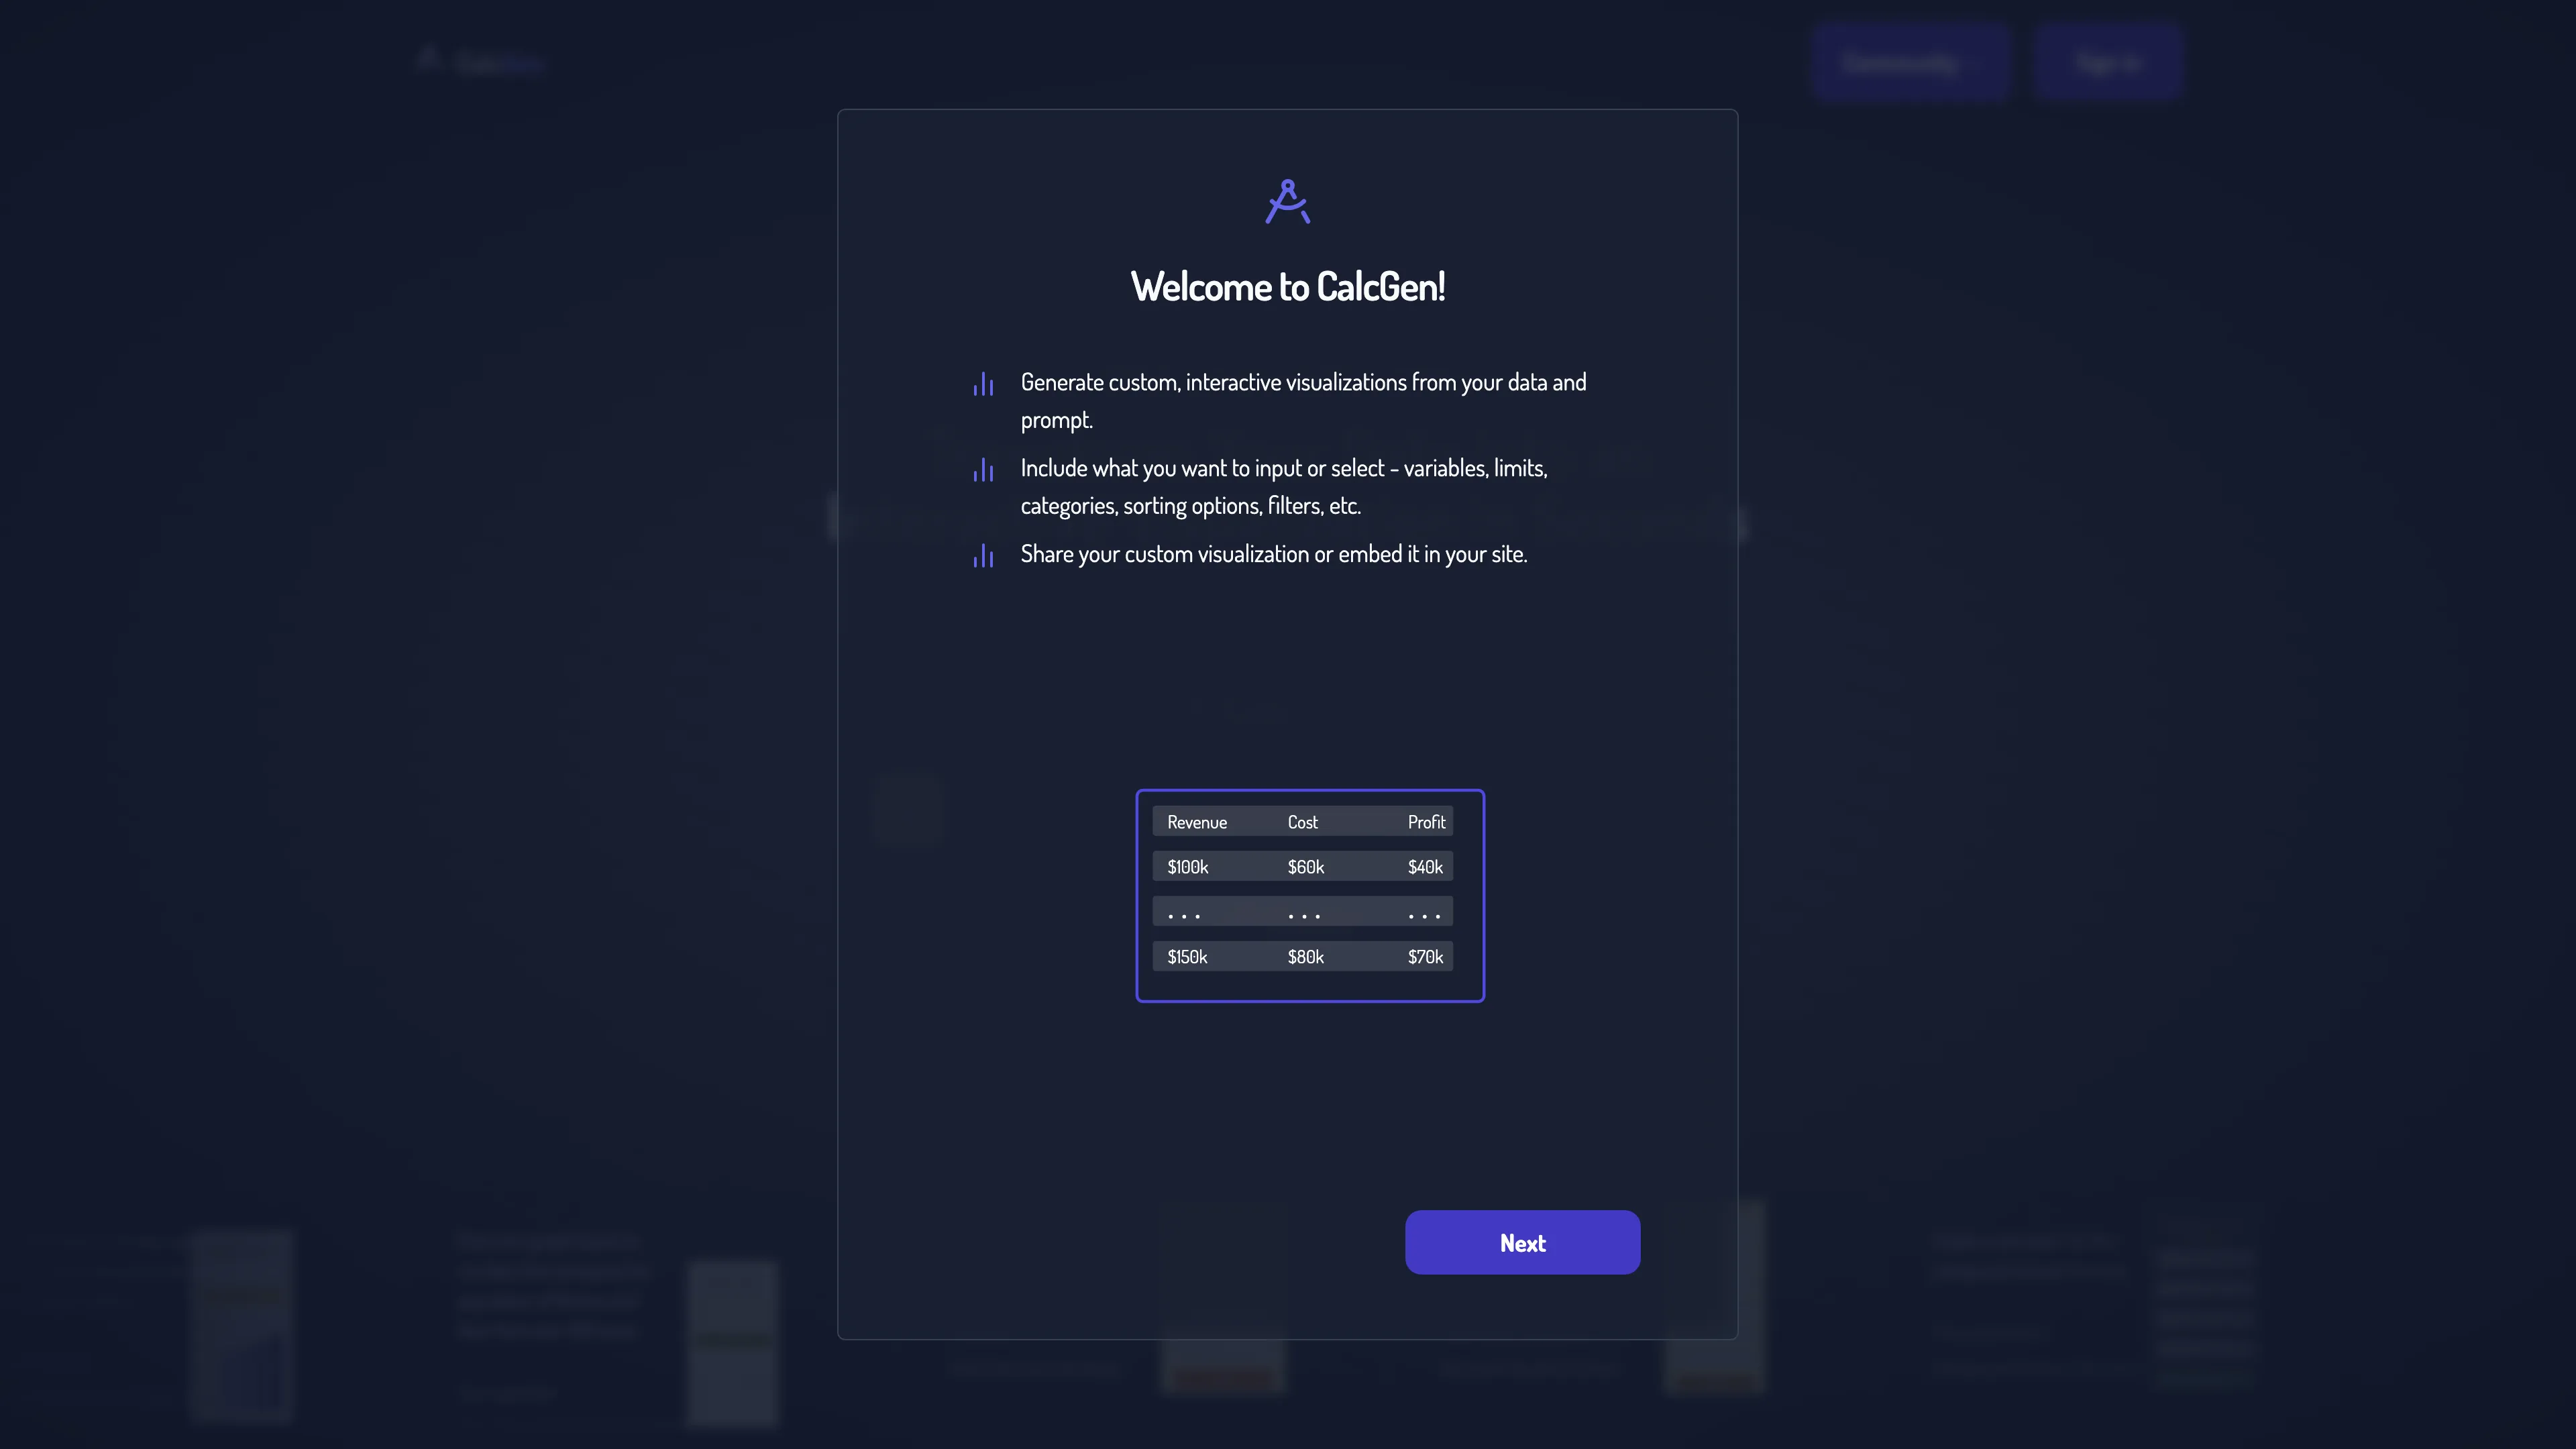
Effortlessly create interactive data visualizations with CalcGen AI, using your data or letting the AI gather it — no data cleaning required!
CalcGen AI Introduction
CalcGen AI makes creating interactive data visualizations a breeze. This tool is incredibly flexible, allowing users to generate custom charts and graphing calculators with simple prompts. Whether you're uploading your own data or letting CalcGen scour the web for relevant information, this platform simplifies the typically tedious data visualization process. Imagine turning a straightforward spreadsheet or even a screenshot into an engaging, interactive graph without needing to clean or format the data first. The 'Showcase' page is a nifty feature too, offering inspiration by letting the community share their creations. CalcGen AI is poised to revolutionize how data is visualized, making it an ideal choice for anyone looking to present data dynamically and effortlessly.
CalcGen AI Key Features
Effortless Data Upload
No need for tedious data cleaning or formatting steps. Simply upload your file or even paste a screenshot, and CalcGen AI handles the rest. It allows you to focus on insights, not preparation.
Intelligent Data Searching
If you don't have your data ready, CalcGen AI can search the web for relevant information. It finds the necessary data and cites sources, streamlining the data acquisition process.
Customizable Interactive Visualizations
Generate beautiful, interactive, and customizable charts and calculators. Just describe what you want to visualize and control, and watch as your inputs transform into meaningful graphics.
Showcase Page for Inspiration
A communal 'Showcase' page where users can submit and share their creations. It's a great way to find inspiration and see how others are utilizing the tool.
Future-Proof with Upcoming Features
CalcGen AI is continually evolving with features like database connections and real-time updates in the pipeline. It ensures that the tool remains powerful and versatile for future needs.
CalcGen AI Use Cases
Business Analyst Dashboards: A business analyst can leverage CalcGen AI to create interactive dashboards from raw data quickly. Simply upload sales or marketing data, dictate key metrics such as revenue, cost, and profit, and visualize trends instantly. This transformation enhances data-driven decision-making without needing extensive data cleaning.
Educational Tools: Teachers and lecturers can utilize CalcGen AI to design interactive graphing calculators to demonstrate complex mathematical equations. By inputting desired equations and variables, they can create an engaging learning experience, making abstract concepts concrete for students.
Market Research: Market researchers can use CalcGen AI to visualize data found online about consumer behavior or market trends. They can describe the kind of information they need, and the AI will fetch and plot the data, complete with cited sources. This accelerates data collection and visualization, saving time and resources.
Website Embedding for Startups: Startups can embed custom, interactive visualizations on their websites using CalcGen AI. Founders can upload user data or metrics they want to showcase and customize graphs that dynamically represent their business growth. This feature enhances transparency and engagement with potential investors and customers.
Scientific Research: Researchers can upload their experimental data to CalcGen AI and create detailed, interactive visualizations. By specifying variables and controlling input parameters, they can produce highly customizable charts that aid in presenting and analyzing complex findings efficiently.
CalcGen AI User Guides
Step 1: Upload your data file or paste a screenshot on CalcGen's website.
Step 2: Describe what you want plotted and any interactive features you need.
Step 3: Sit back while CalcGen cleans your data and generates a custom visualization.
Step 4: If you don't have data, let CalcGen research and cite sources for your visualization.
Step 5: Share or embed your interactive visualization using the provided options.
CalcGen AI Frequently Asked Questions
CalcGen AI Website Analytics
CalcGen AI Alternatives
PineAI's assistant handles bill negotiations, customer support calls, and subscription cancellations, saving you time and reducing costs by using AI-powered strategies.
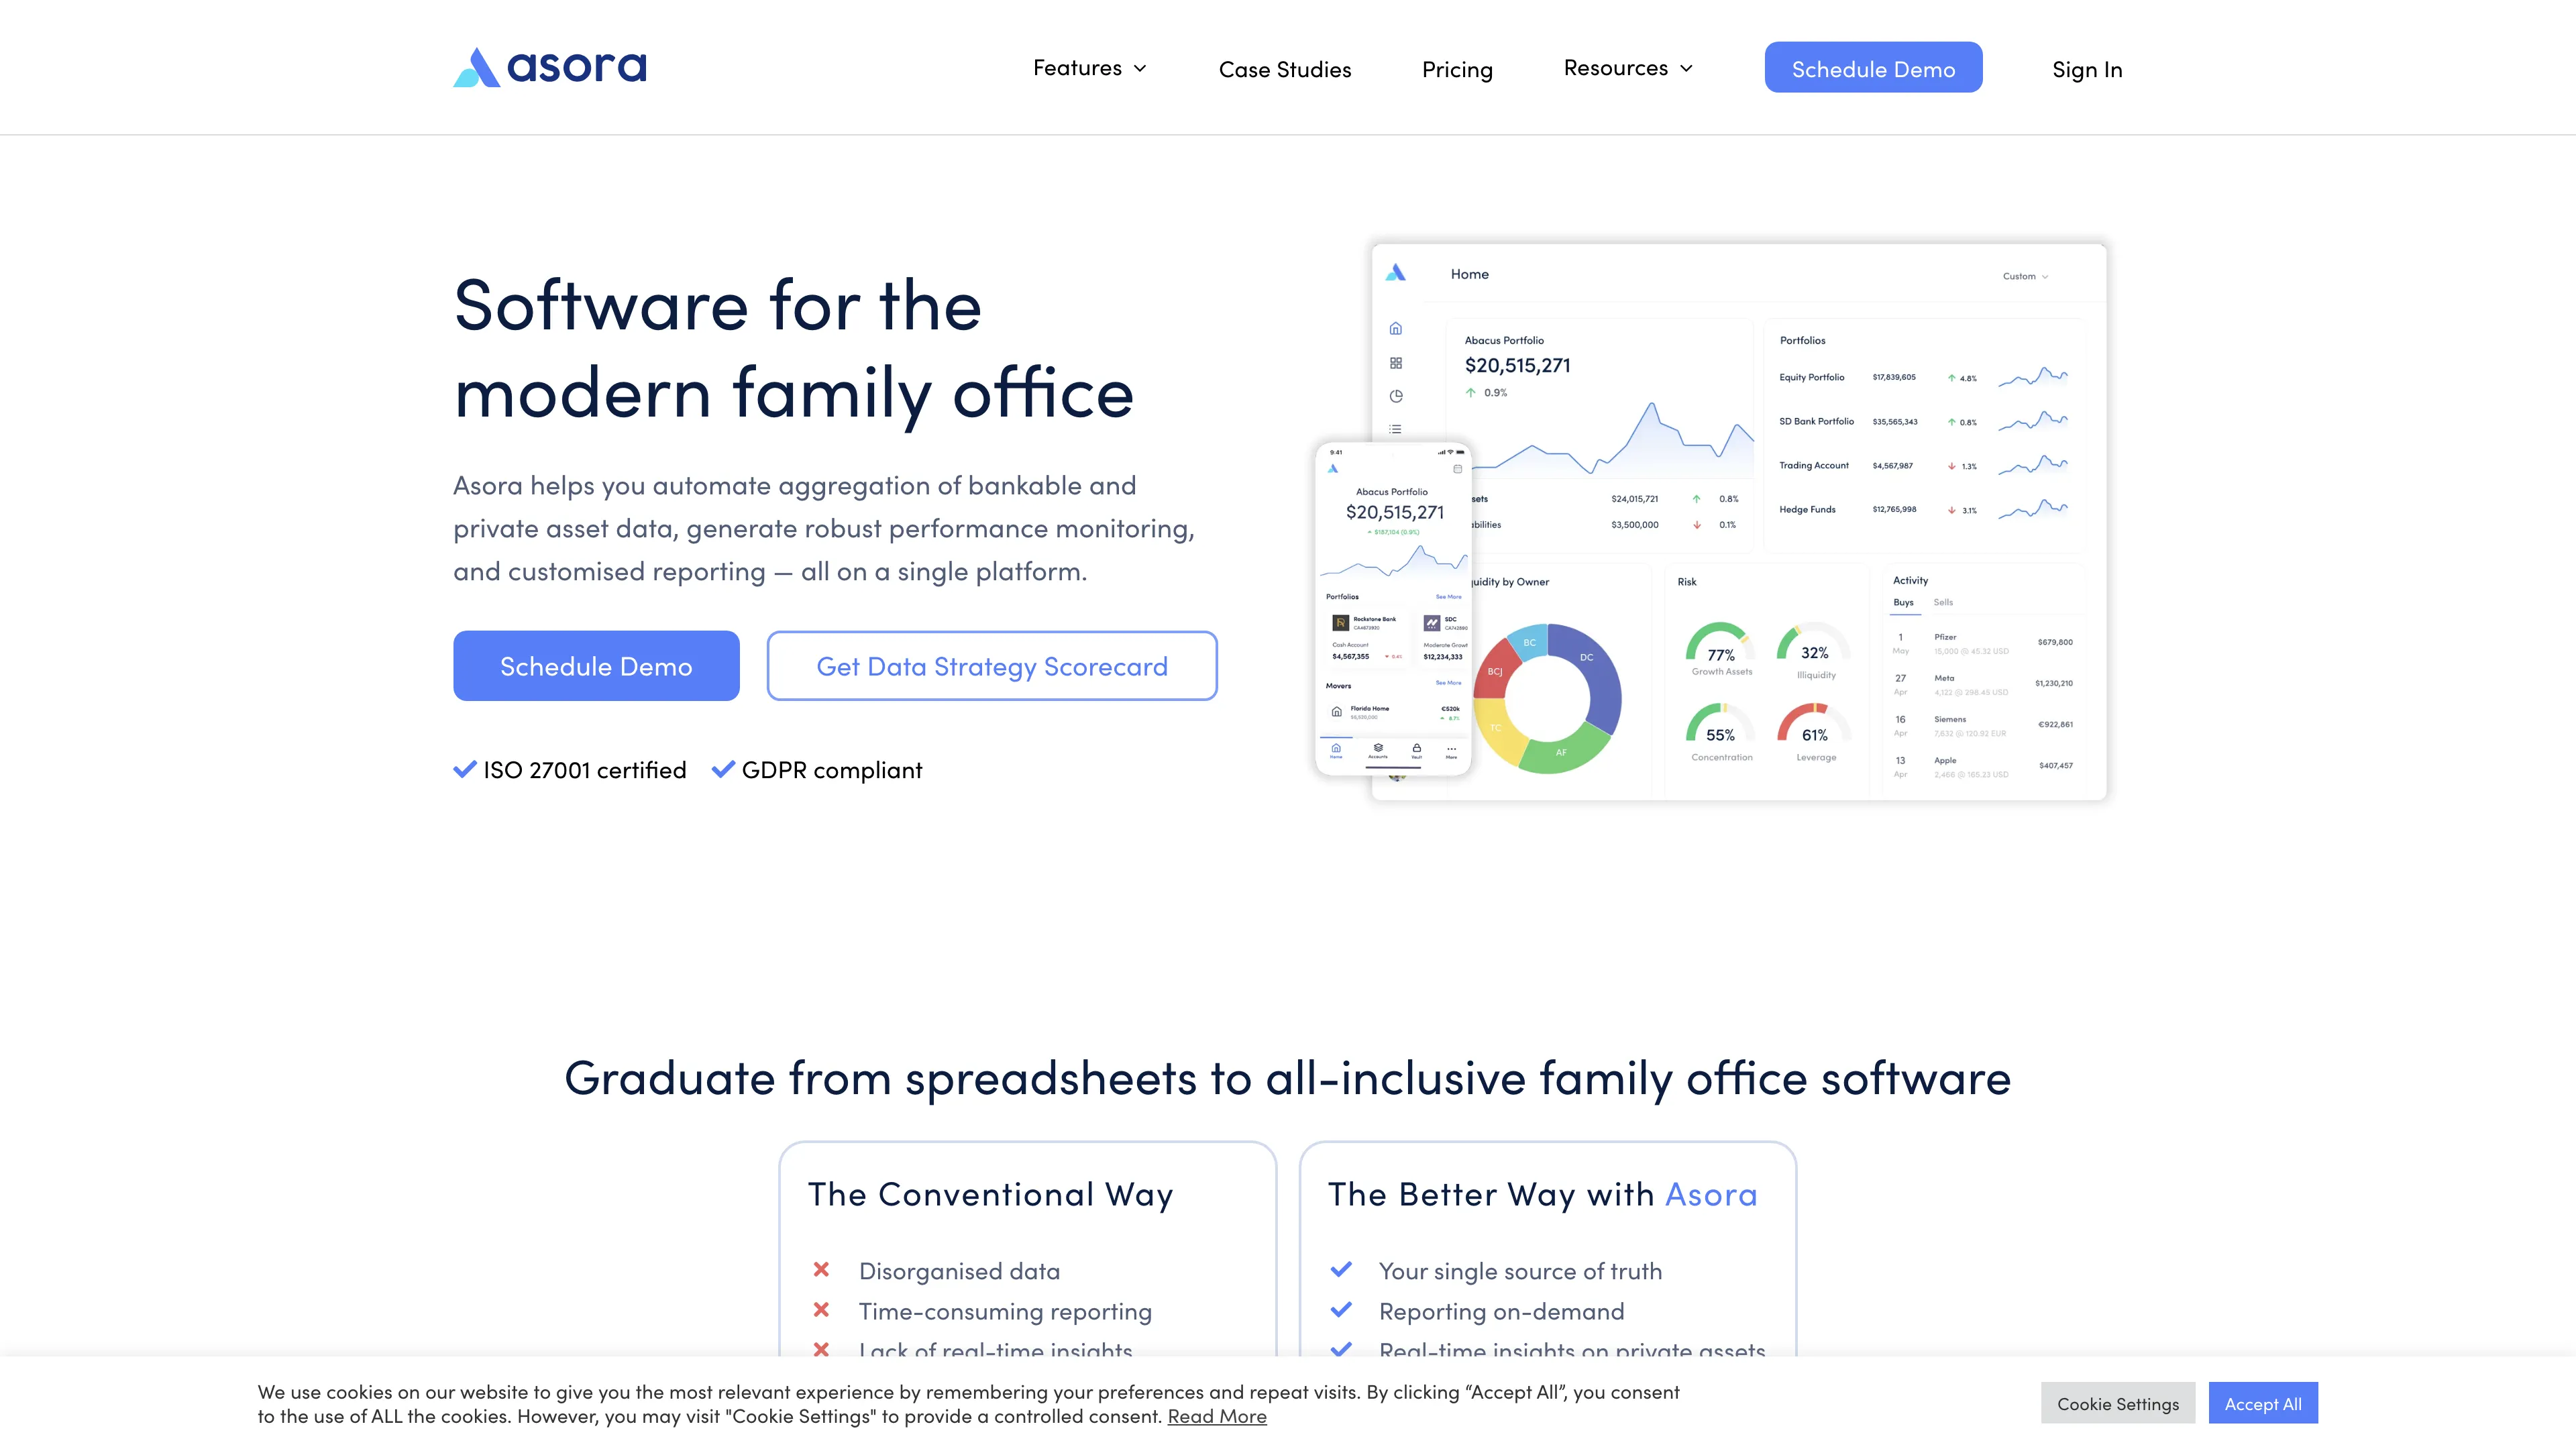
Asora is a SaaS platform simplifying family office operations by automating asset tracking and providing on-demand, customized performance reports.
Bright Data provides award-winning proxy networks, AI-powered web scrapers, and business-ready datasets, offering ethical, compliant, and secure web data collection for over 20,000 customers worldwide.
CompanyGPT helps identify high-growth companies by specific criteria like size, location, and growth metrics, offering detailed insights into trending businesses.
Contacted.io leverages AI to deliver detailed SEO and content reports, optimizing website visibility and engagement with easy-to-follow, platform-specific guidance.